
CRO audit service
Find out what’s costing you sales before you redesign anything.
I go through your site the way your customers do, check it against your analytics, heatmaps and recordings, and hand you a ranked list of what to fix and test first. One page or the whole site.
Problems I fix
When a CRO audit makes sense
Traffic is fine, sales aren’t
People arrive from ads and search, then leave. An audit shows where they drop off and why.
You’re about to redesign
Know what is actually broken before you pay for a new site, so the redesign fixes the right things.
You want to start A/B testing
An audit gives you a backlog of tests worth running, ranked, with a hypothesis for each.
Something changed and nobody knows why
Conversion dropped after a launch or a new theme. I find the page, the device or the step that broke.
Sample audit
A real mini audit: the Allbirds Wool Runner page
One product page, the way I would audit it for a client. Allbirds’ US store, Men’s Wool Runner, on a phone, checked on November 19, 2026. Only what anyone can see on the page.
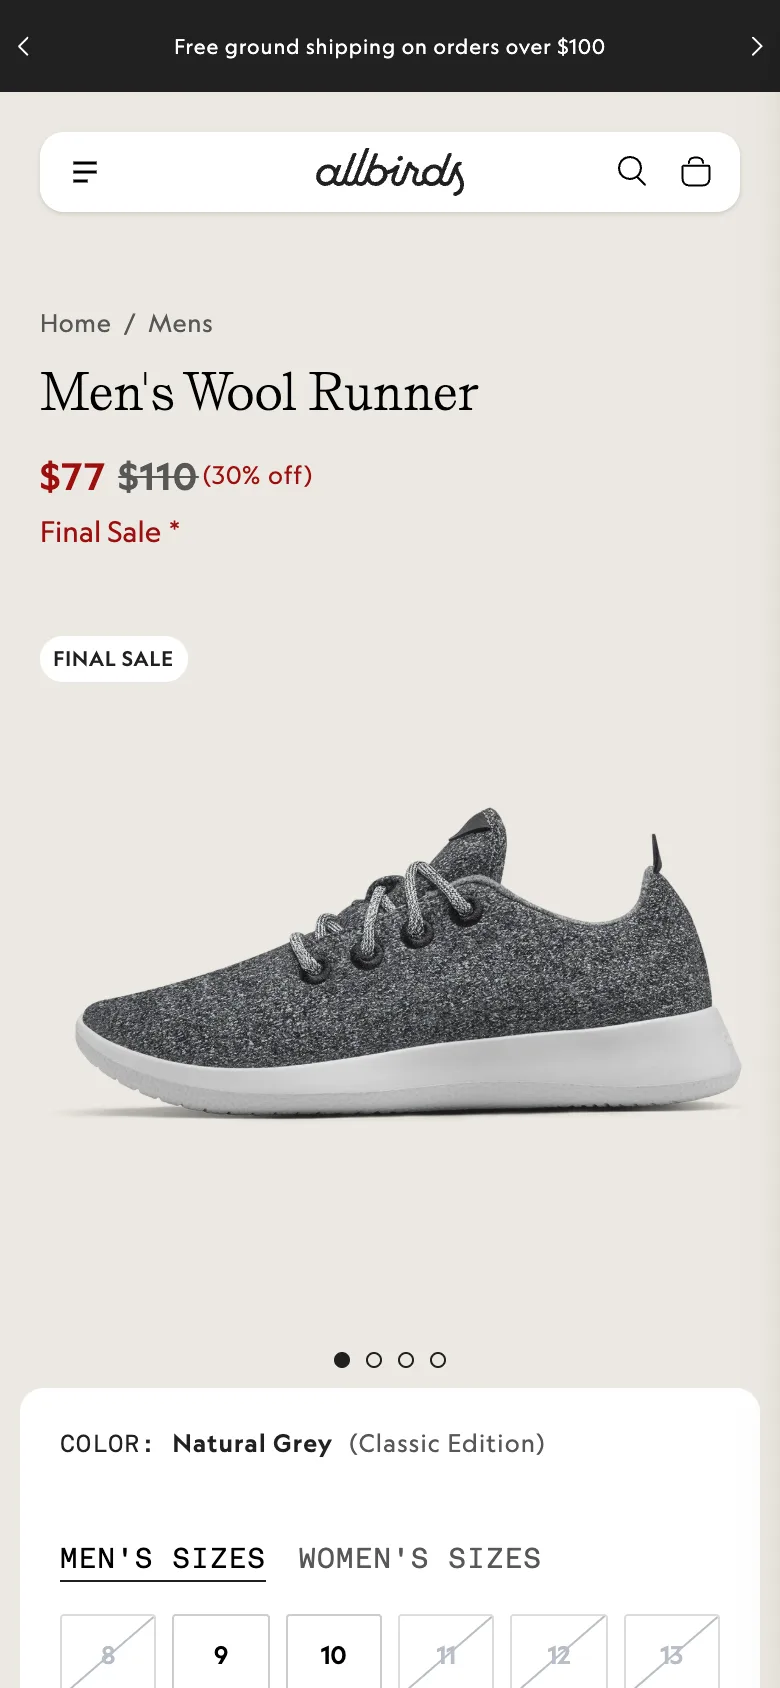
“Final Sale” twice, and an asterisk with no answer
- What I see
- The price area says “Final Sale*” in red and a second “FINAL SALE” badge sits on the photo. I couldn’t find what the asterisk refers to anywhere on the page.
- Why it likely costs sales
- Shoes are bought on fit. When a shopper isn’t sure about the size and doesn’t know if they can return a final sale item, the safest choice is to leave.
- What I’d test
- One plain line under the price that says what final sale means for returns and exchanges, next to the fit note.
No star rating near the title or the price
- What I see
- The first screen shows the name, the price and the photo, but no rating. The reviews section starts about 70% of the way down the page.
- Why it likely costs sales
- For a well-known shoe, the rating is the fastest proof that it’s worth $77. Most shoppers on mobile never scroll that far.
- What I’d test
- A rating summary with the review count under the title, linked to the reviews.
The photo fills the first screen, the button doesn’t
- What I see
- On a 390 px wide phone the product photo takes most of the first screen. The size picker starts at the bottom edge and the button is below it.
- Why it likely costs sales
- The page asks people to scroll before it shows them how to buy. On a sale page full of returning visitors, that is wasted attention.
- What I’d test
- A shorter first image with the sizes visible, plus a sticky “Add to cart” bar once the shopper scrolls past the picker.
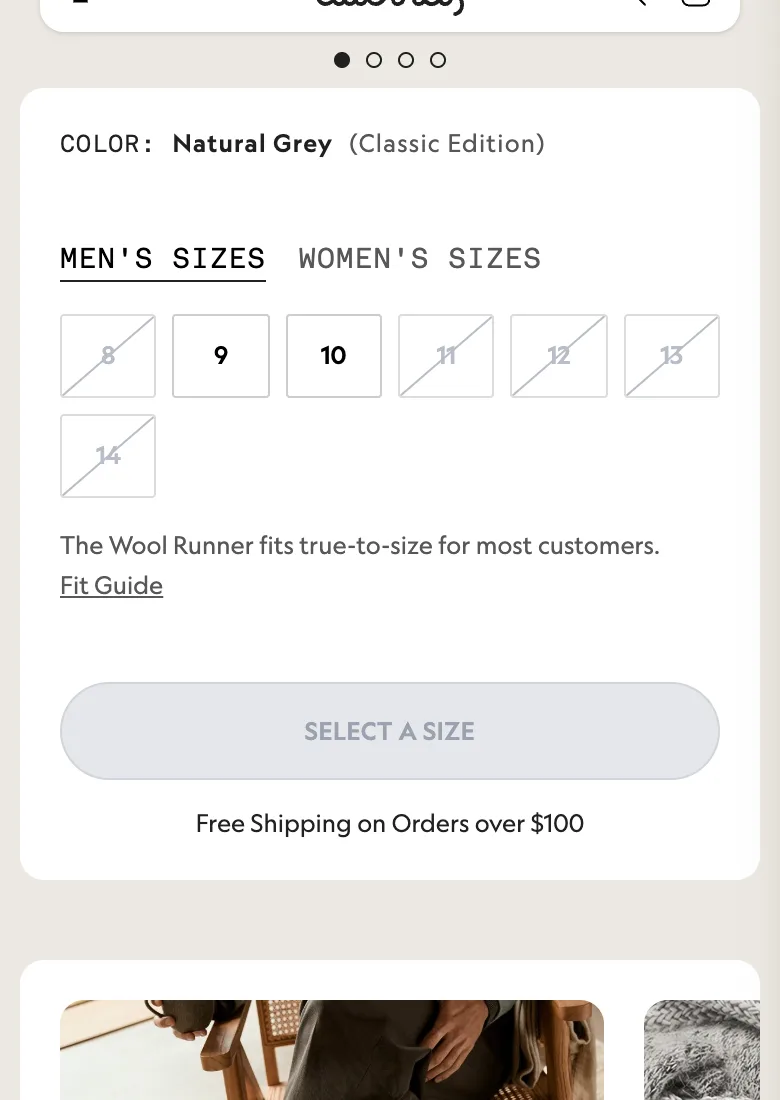
Five of seven sizes crossed out, with no next step
- What I see
- On the day I checked, men’s sizes 8, 11, 12, 13 and 14 were crossed out. There is no “notify me” option or suggestion near them.
- Why it likely costs sales
- Anyone outside sizes 9 and 10 hits a dead end on the product they came for, and the page doesn’t try to keep them.
- What I’d test
- A “Get notified” link for sold-out sizes, and other colors or styles that are in stock in the size they tapped.
Free shipping starts at $100, the shoe costs $77
- What I see
- Under the button: “Free Shipping on Orders over $100”. The sale price is $77, so a one-pair order is $23 short.
- Why it likely costs sales
- A shipping fee that shows up at checkout is one of the most common reasons people abandon a cart.
- What I’d test
- A small add-on near the button, for example a pair of socks, framed as “add this and shipping is free”.
What works
“The Wool Runner fits true-to-size for most customers” with a Fit Guide link, right under the sizes. That answers the biggest question for shoes, in the right place. I would keep it.
I’m not affiliated with Allbirds, and pages change, so some of this may already be different. A real audit adds your analytics, heatmaps and recordings, which show how big each problem is.
The data part
Then I check every finding against your data
With access to your GA4 and Microsoft Clarity, I measure where people drop off, how far they scroll and where they get stuck, so the list is ranked by what costs you the most.
Example data, made up to show the format. I don’t have Allbirds’ analytics.
Funnel drop-off (GA4)
Share of product page visitors who reach each step, and how many are lost between steps.
- Product page views100%
- Picked a size41%−59%
- Added to cart23%−44%
- Started checkout12%−48%
- Purchased6%−50%
Scroll map (Clarity)
How many visitors see each section. Anything under a third is close to invisible.
- Title and price100%
- Size picker78%
- Details46%
- You may also like29%
- Reviews17%
Recordings and click maps (Clarity)
I watch sessions from the pages that leak most and note what people try to do.
- Rage clicks on crossed-out sizes
- Dead clicks on photos and labels that look tappable
- Quick backs to the collection page
- Taps on the asterisk, the shipping line and the fit guide
- Mobile and desktop, new and returning, paid and organic, side by side
Priorities
Every finding scored, then turned into a test
I score each idea from 1 to 10 for impact, confidence and ease and multiply them, the method from my ICE scoring guide. My scores, from the page alone.
| # | Test idea | Impact | Confidence | Ease | ICE |
|---|---|---|---|---|---|
| 2 | Show the star rating and review count under the title | 7 | 8 | 9 | 504 |
| 3 | Shorter first image and a sticky Add to cart bar | 8 | 7 | 7 | 392 |
| 1 | Explain what final sale means right under the price | 6 | 7 | 9 | 378 |
| 5 | Free shipping add-on next to the button | 6 | 6 | 7 | 252 |
| 4 | Notify me and in-stock options for sold-out sizes | 7 | 6 | 5 | 210 |
Hypotheses ready to run
Rating under the title
Because the rating sits far down the page, I believe showing the stars and review count under the title will raise add-to-cart rate on mobile. I’ll know it worked when add-to-cart rate goes up without a drop in revenue per visitor.
Buy button in reach
Because the first screen is almost all photo, I believe a shorter image and a sticky Add to cart bar will get more shoppers to pick a size. I’ll measure size selections and add-to-cart rate.
Final sale, explained
Because “Final Sale*” has no explanation, I believe one clear line about returns and exchanges will reduce hesitation. I’ll watch add-to-cart rate and quick exits from the page.
Free shipping nudge
Because one pair falls $23 short of free shipping, I believe an add-on offer near the button will raise average order value. I’ll measure order value and revenue per visitor.
Proof
Audits that turned into results
Real client work: the before and after, every change and why it was made.

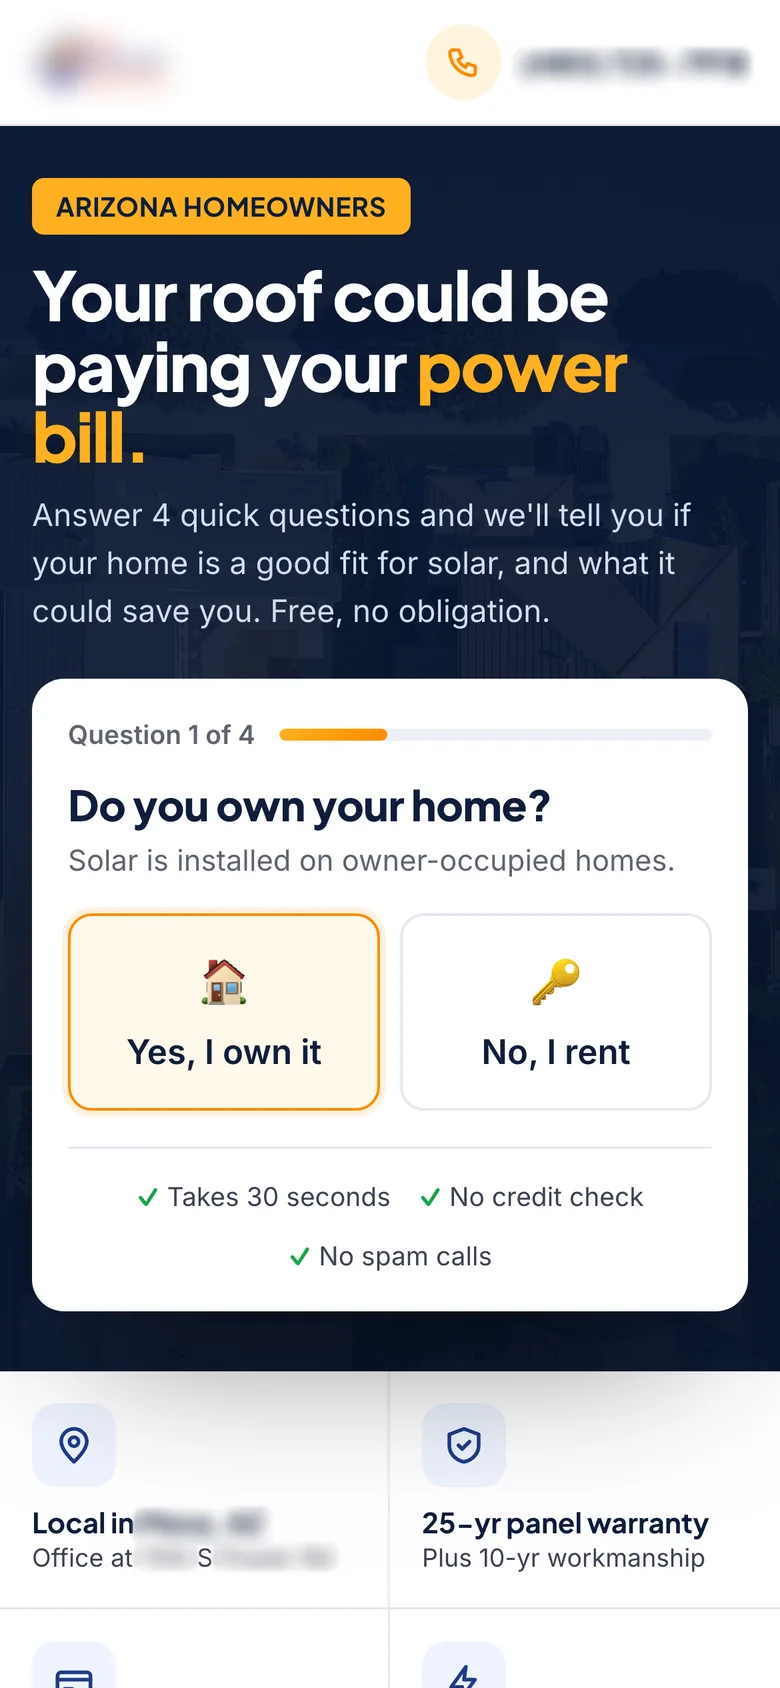
Solar ad and landing page
A broken quote page replaced by a Meta ad and a matching landing page with a 4-step quiz that starts in the hero. It won a 3-week A/B test: +20% conversion rate, 15% lower cost per lead.
Read case study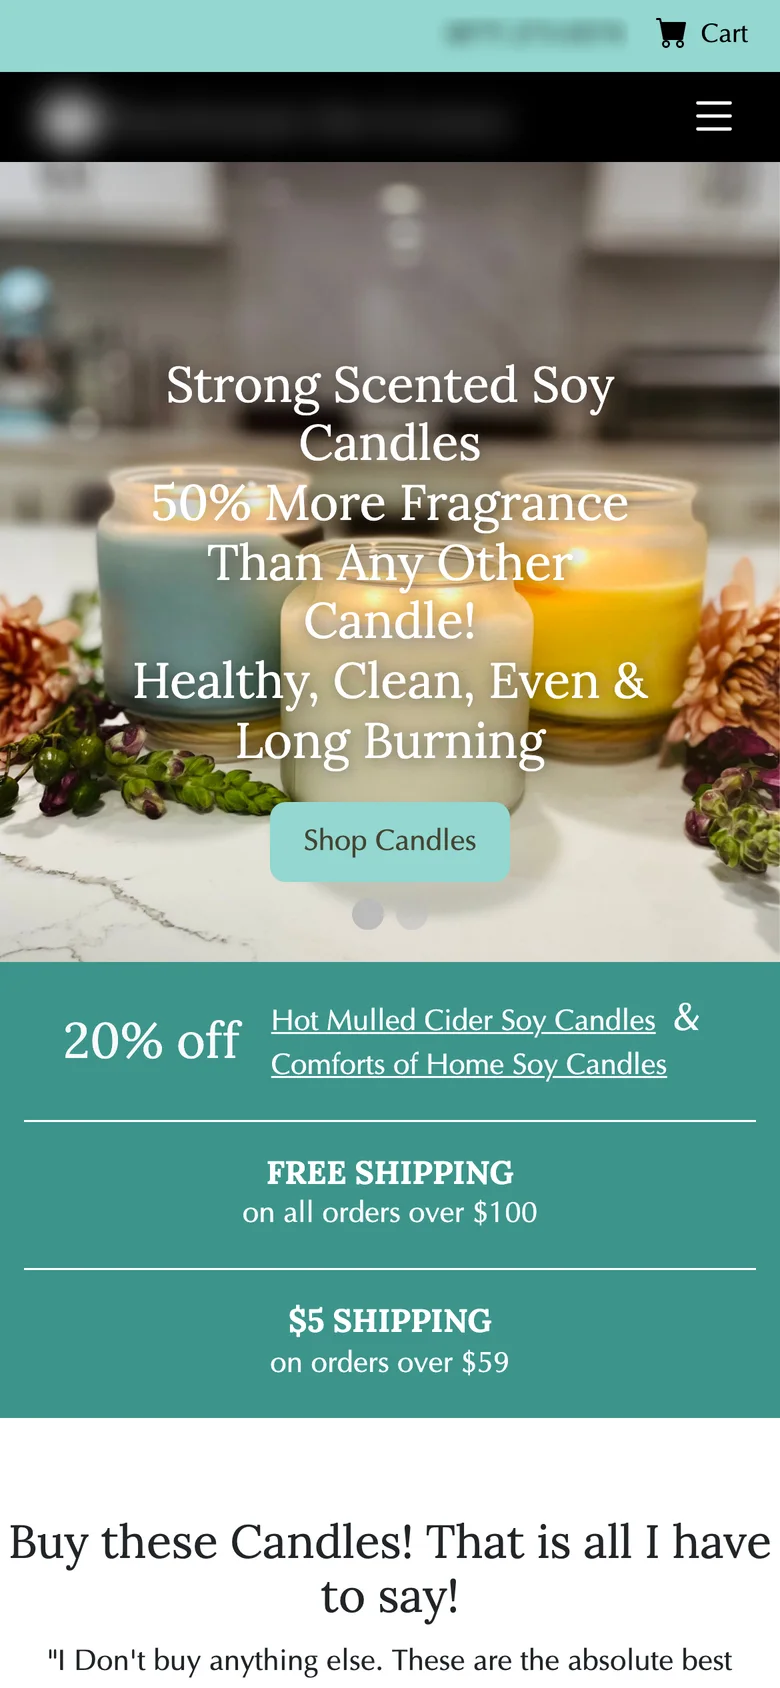
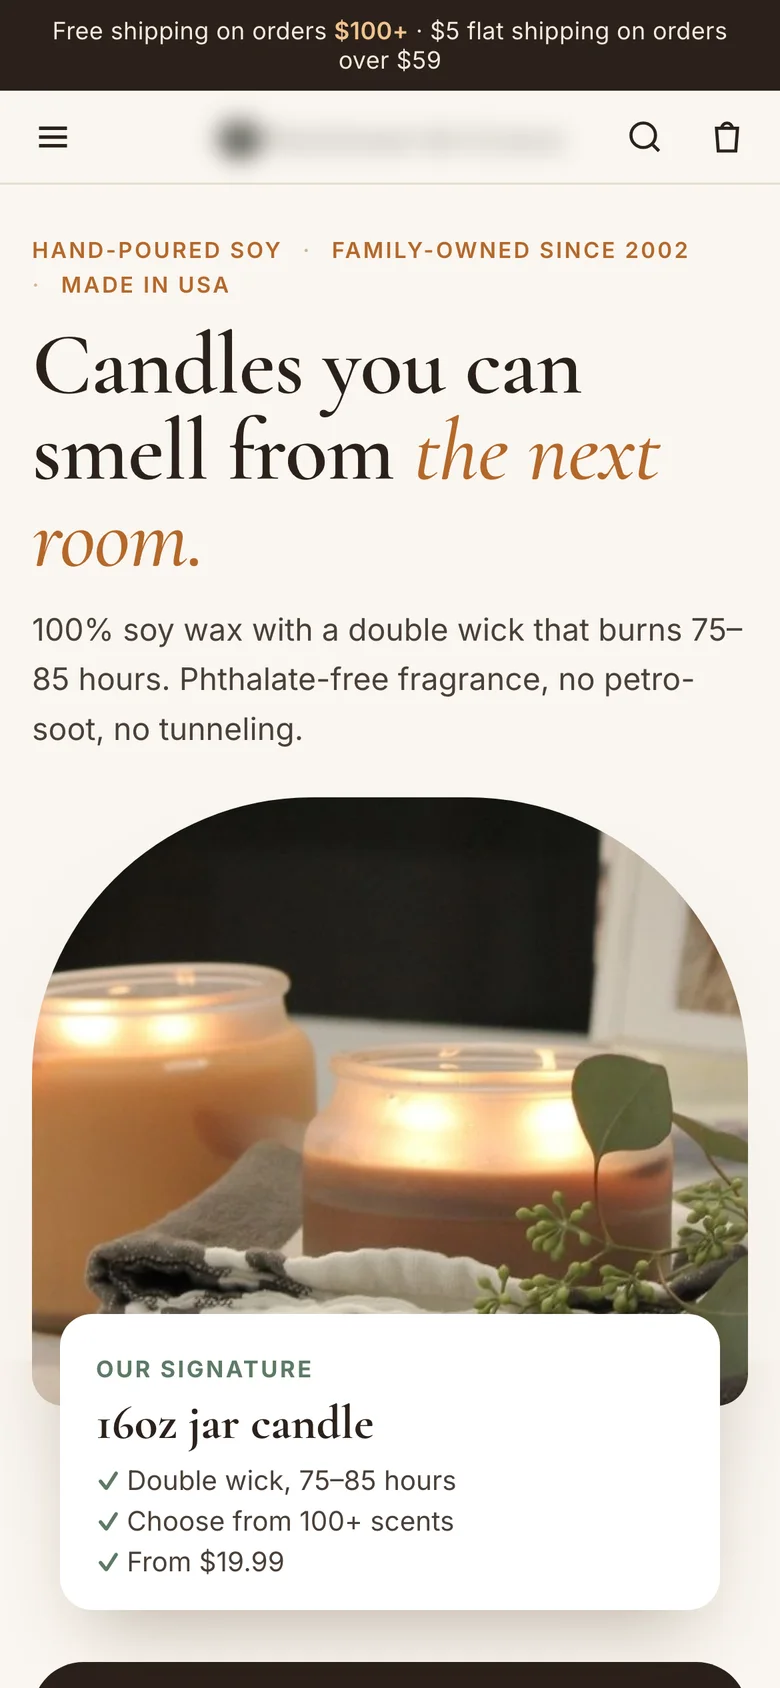
Soy candle homepage
A slider and long text rebuilt around one promise, a scent strength scale, bestsellers and a 3-or-6 candle shipping nudge. It won a 4-week A/B test: +10% revenue per visitor, 12% lower bounce rate.
Read case study
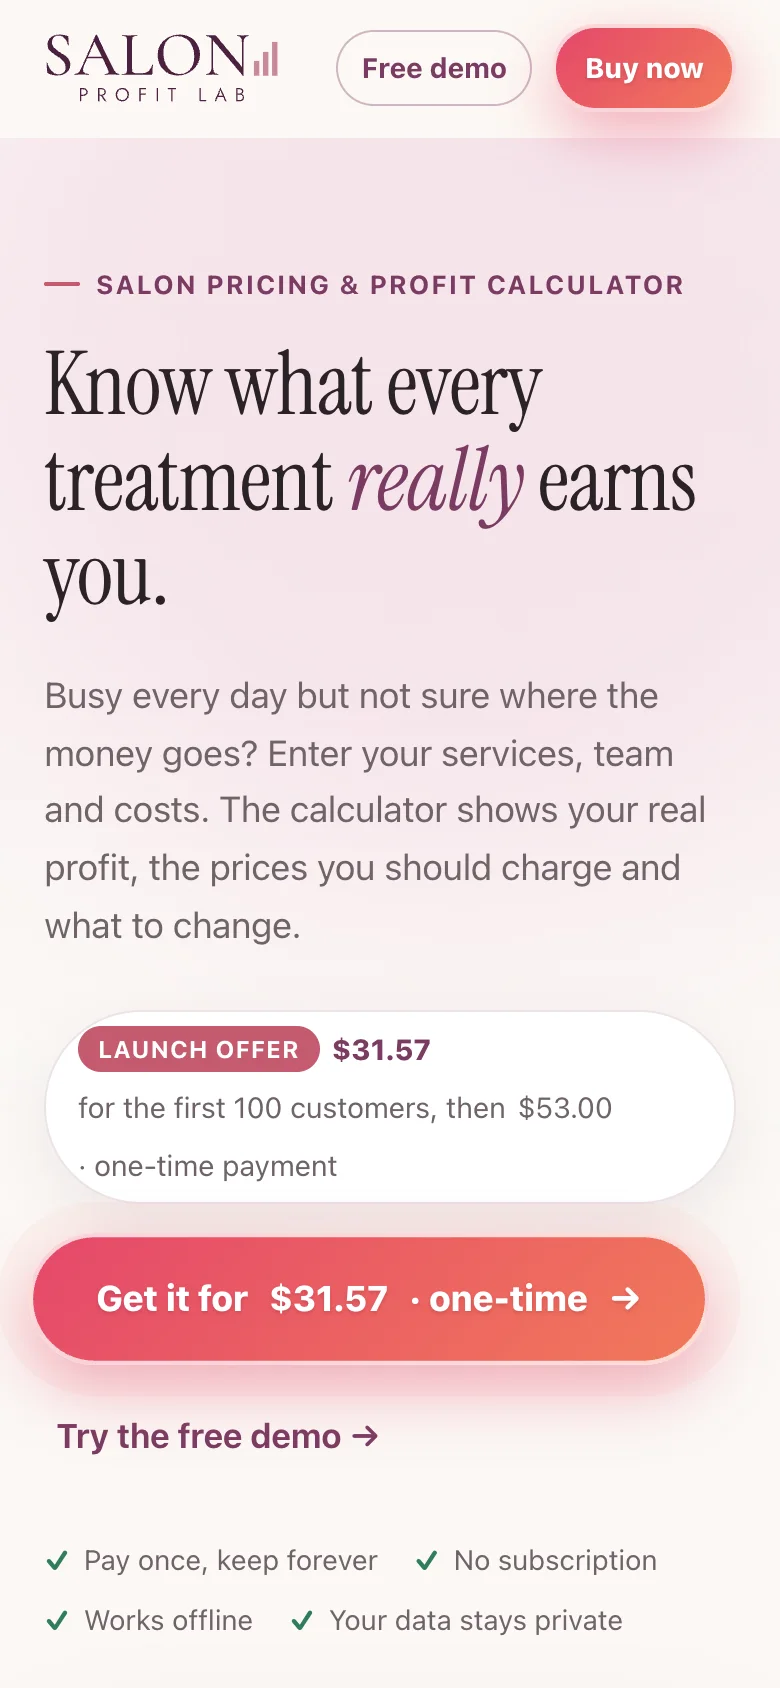
Salon Profit Lab website
A dated template with a stock photo and a pale “Learn more” button, rebuilt as a site that shows the calculator working, says the price up front and tells one story from problem to purchase.
Read case studyGeorge started with a detailed analysis of my old site before touching a single pixel. Within days he came back with a clear idea of what to change and why, and the new site nailed it. It finally looks like the work I actually do. I’d highly recommend George for any CRO or website project!
Djordje was a great asset to our team and always did his best to come up with new and innovative CRO ideas. Thanks for all your help!
What you get
What you get from a CRO audit
Recorded walkthrough
A video of me going through your pages on mobile and desktop, explaining each problem as I find it.
Annotated screenshots
Every issue marked on a real screenshot, with what I see, why it likely costs sales and what I’d change.
Analytics and behavior review
Funnel drop-off in GA4, scroll and click maps and session recordings in Microsoft Clarity.
ICE-scored priority list
Every finding scored for impact, confidence and ease, so you know what to do first.
3 to 5 test hypotheses
Written and ready to run, each with the metric that decides it.
A call to go through it
We go through the findings together and you leave with a clear plan.
How it works
How I do a CRO audit
Scope
We pick the pages that matter most, from one product or landing page to the full path from ad to purchase.
Walk the path
I go through it like a customer, mobile first, from the ad or search result to the thank-you page.
Check the data
GA4 for drop-off by step and device, Clarity heatmaps and recordings for what people actually do.
Rank and hand over
Findings scored with ICE, turned into hypotheses and delivered with the walkthrough video.
Why me
Why hire me for your CRO audit
I’ve designed 300+ A/B tests
I know which problems are worth fixing because I’ve seen what wins and what doesn’t across hundreds of tests.
I can fix what I find
Most audits end with a PDF. I can design, build and test the fixes myself, so nothing stays on a list.
Results in money
I rank problems by what they cost you, and read every test in revenue per visitor.
CXL certified
Certified in Conversion Optimization and Ecommerce Marketing by CXL.
FAQ
Questions about a CRO audit
How much does a CRO audit cost?
It depends on the scope: one page, one funnel or the whole site. After a short call I send a fixed quote.
How long does it take?
About one week for a single page or funnel. A full site takes longer, and I tell you the date up front.
What access do you need?
View access to GA4 and Microsoft Clarity if you have them. If you don’t, I can set up Clarity, or audit from the live site alone.
What tools do you use?
GA4, Microsoft Clarity, Figma for annotated screens and Claude for research and analysis. I work with your A/B testing tool for the tests.
Can you fix the problems you find?
Yes. I can design and build the changes and A/B test them, so you know what each fix is worth.
Read more
Related articles
CRO audit checklist: 25 checks for a landing page
A 25-point CRO audit checklist for landing pages: message match, clarity, trust, forms, mobile, speed and tracking, and what to test first.
Read articleHow to prioritize A/B tests with an ICE score sheet
How to score A/B test ideas with ICE (Impact, Confidence, Ease): scoring anchors, an example sheet, the columns to track, mistakes, and ICE vs PIE vs PXL.
Read articleRevenue per visitor (RPV): formula, benchmarks and how to increase it
What revenue per visitor (RPV) is, how to calculate it, a free RPV calculator, what a good RPV is by industry, and 10 ways to increase it in ecommerce.
Read articleOther services: Website design · Landing page design · Funnel design · Ad creatives · A/B testing
CRO designer for: Ecommerce & Shopify · Lead generation · SaaS & B2B · DTC brands
New to the role? Read what a CRO designer does and how to hire one.
Let’s talk
Let’s make your next test a winner.
Tell me about your funnel. I’ll point out quick wins, tell you what I’d test first, and say honestly whether I’m the right fit.