Ecommerce homepage redesign: 2 A/B tests that raised revenue per visitor
Short answer
I redesigned the homepages of two small online stores, a soy candle brand and a hot sauce brand, and tested each one against the old homepage. The candle homepage won a 4-week A/B test with +10% revenue per visitor and 12% lower bounce rate. The hot sauce homepage won a 20-day test with +8% revenue per visitor and 10% lower bounce rate. Both followed the same idea: answer the shopper’s first question on the first screen, show products with prices right away, and give people a reason to buy more than one item.
Key takeaways
- Put products, prices and a clear button on the first screen. Both old homepages showed none.
- Answer the buyer’s biggest worry first: “will I smell it?” for candles, “how hot is it?” for hot sauce.
- Use a bundle or shipping threshold to lift order size, not only conversion rate.
- Replace general claims like “award-winning” with specific proof next to the button.
- Judge a homepage redesign on revenue per visitor, because good changes move both conversion and order value.
Why judge a homepage on revenue per visitor?
Revenue per visitor (RPV) is total revenue divided by visitors, which is the same as conversion rate times average order value. A homepage redesign usually moves both parts. A clearer first screen gets more people to buy, and a visible bundle gets them to buy more. Looking only at conversion rate would miss half of the effect, and it can hide a drop in order value. I explain the formula and benchmarks in what is revenue per visitor.
Test 1: a soy candle homepage, +10% revenue per visitor
The problem: no candles on the first screens. On desktop and on mobile, a visitor scrolled past the hero, a promo strip, a long testimonial and three benefits before seeing a candle, a price or a button to buy. The hero had three centered claims over a busy photo, and on phones the text wrapped into seven lines over the image. Shipping rules were written three different ways. The brand’s best tool, a strength rating for every scent from Light to Wow, was only reachable through a dropdown menu.
What I changed:
- A headline about the number one worry: “Candles you can smell from the next room.” followed by one line of facts: 100% soy, double wick, 75 to 85 hour burn, phthalate-free.
- The scent strength scale under the hero: five steps from Light to Wow, each with the room it fits best. It turns “will I smell it?” into an easy choice.
- Four bestsellers in the first scroll, each with price, a strength badge and “Add to bag”.
- Two buttons: “Shop fall bestsellers” for people ready to buy and “Find your scent strength” for people who don’t know what to pick yet.
- Shipping as a bundle nudge, said once: 3 candles unlock $5 shipping, 6 unlock free shipping. At $19.99 a candle, that moves orders from one or two candles to three or six.
- One line of proof under the buttons, from a real review: “It even travels upstairs into my kids’ rooms.”
- A look that fits the price: warm cream, brown and amber instead of mint buttons and centered text, and a mobile layout where every key element fits the screen.
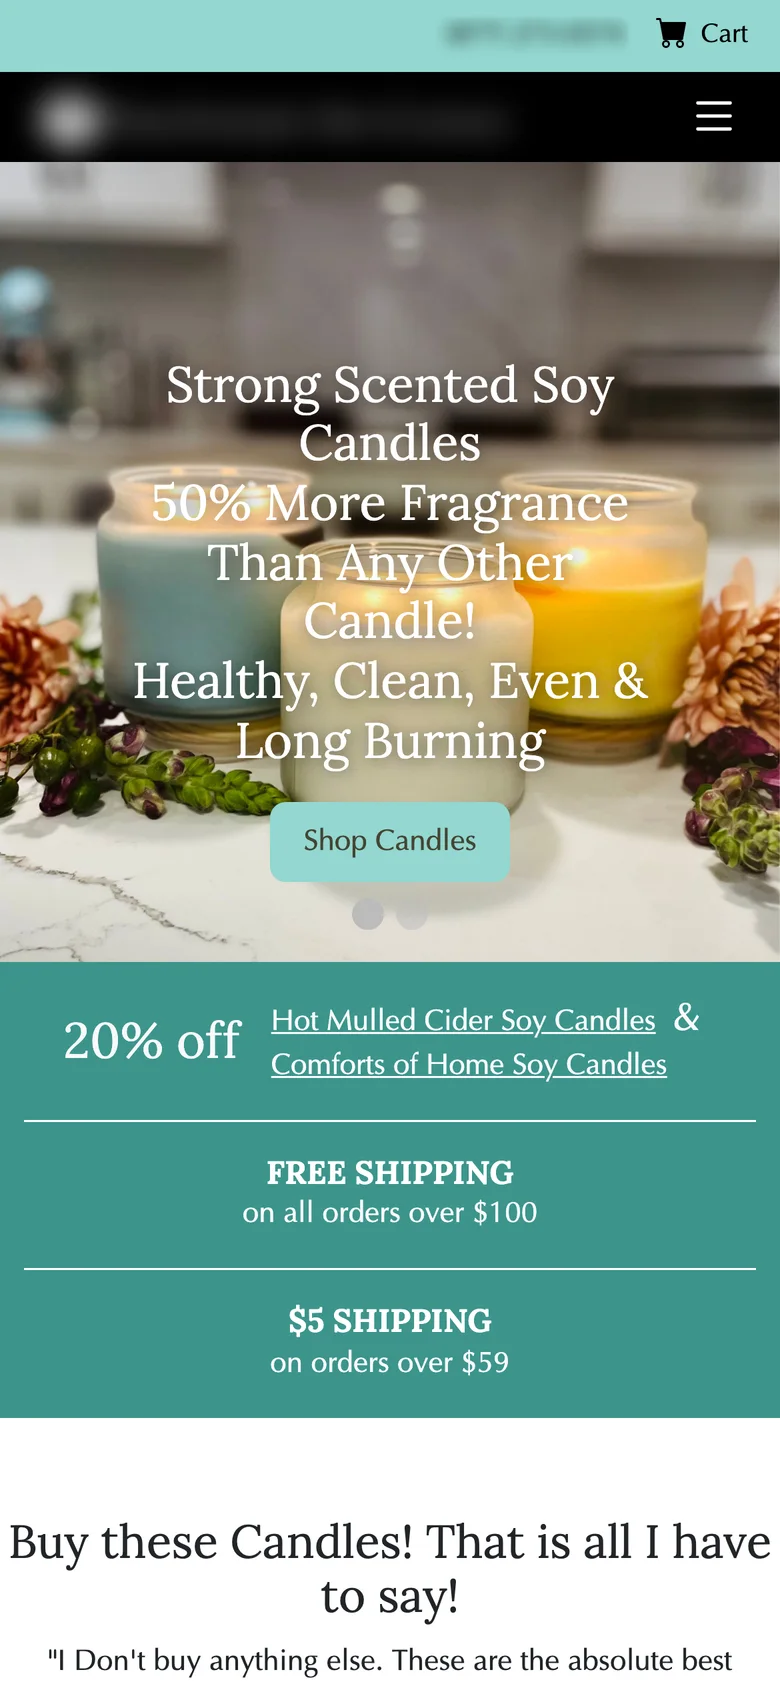
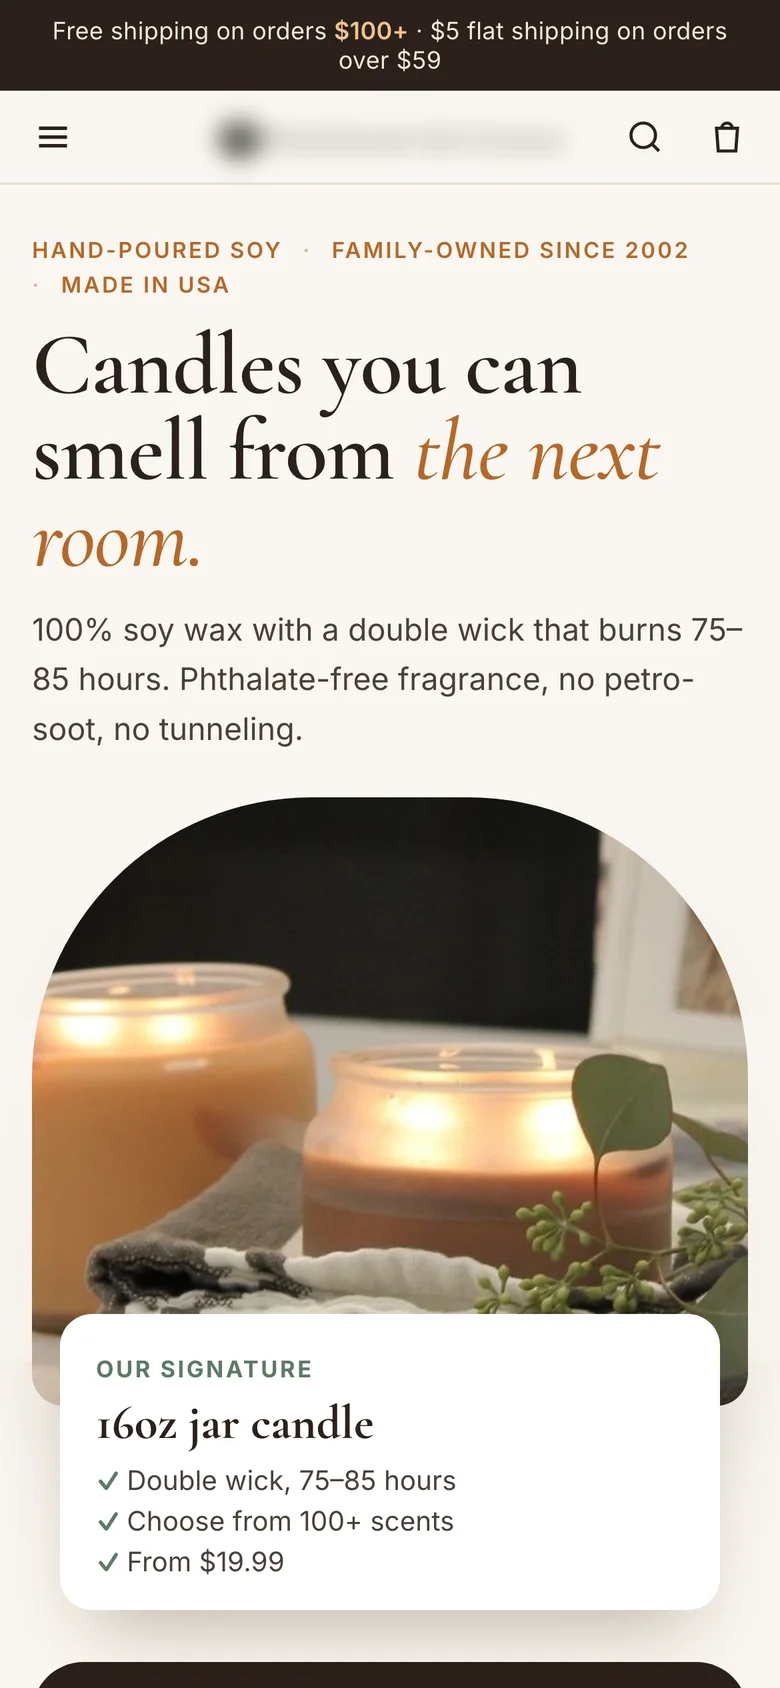
The result: a 4-week A/B test with homepage traffic split 50/50. The new homepage won on revenue per visitor, +10%, and bounce rate fell by 12%.
Test 2: a hot sauce homepage, +8% revenue per visitor
The problem: a magazine cover instead of a shop. Visitors first saw a 15% off pop-up, then a five-slide photo slider with “Award-Winning Gourmet Hot Sauces” and no button at all. A hot sauce shopper wants to know three things: how hot it is, what it tastes like and what it costs. The first screen answered none of them. The heat levels were below the fold, prices only appeared on product pages, and a stray “>” character at the top of every page made the store look broken.
What I changed:
- A headline about how it is made: “Fire-roasted Texas hot sauce. Pick your heat.” with one line on why it tastes different: the peppers are roasted before bottling, so it is smoky, not just hot.
- All six sauces on the first screen, labelled “6 sauces, mild to ghost pepper”.
- A heat picker on the first screen: Mild, Medium, Hot and Extra hot, with Medium selected and a main button that follows the choice, “Shop medium sauces”.
- Price and offer: “From $9.99 per bottle” next to the products, “Mix any 4 sauces for $35.99” in the top bar, and “Build a 4-pack” as the second button.
- Specific proof under the buttons: a 4.97 average rating, triple festival champion and national retail availability, instead of a general “award-winning”.
- A menu named after what people shop for: Hot Sauce, Salsa, Bundles & Gifts, Recipes, Our Story.
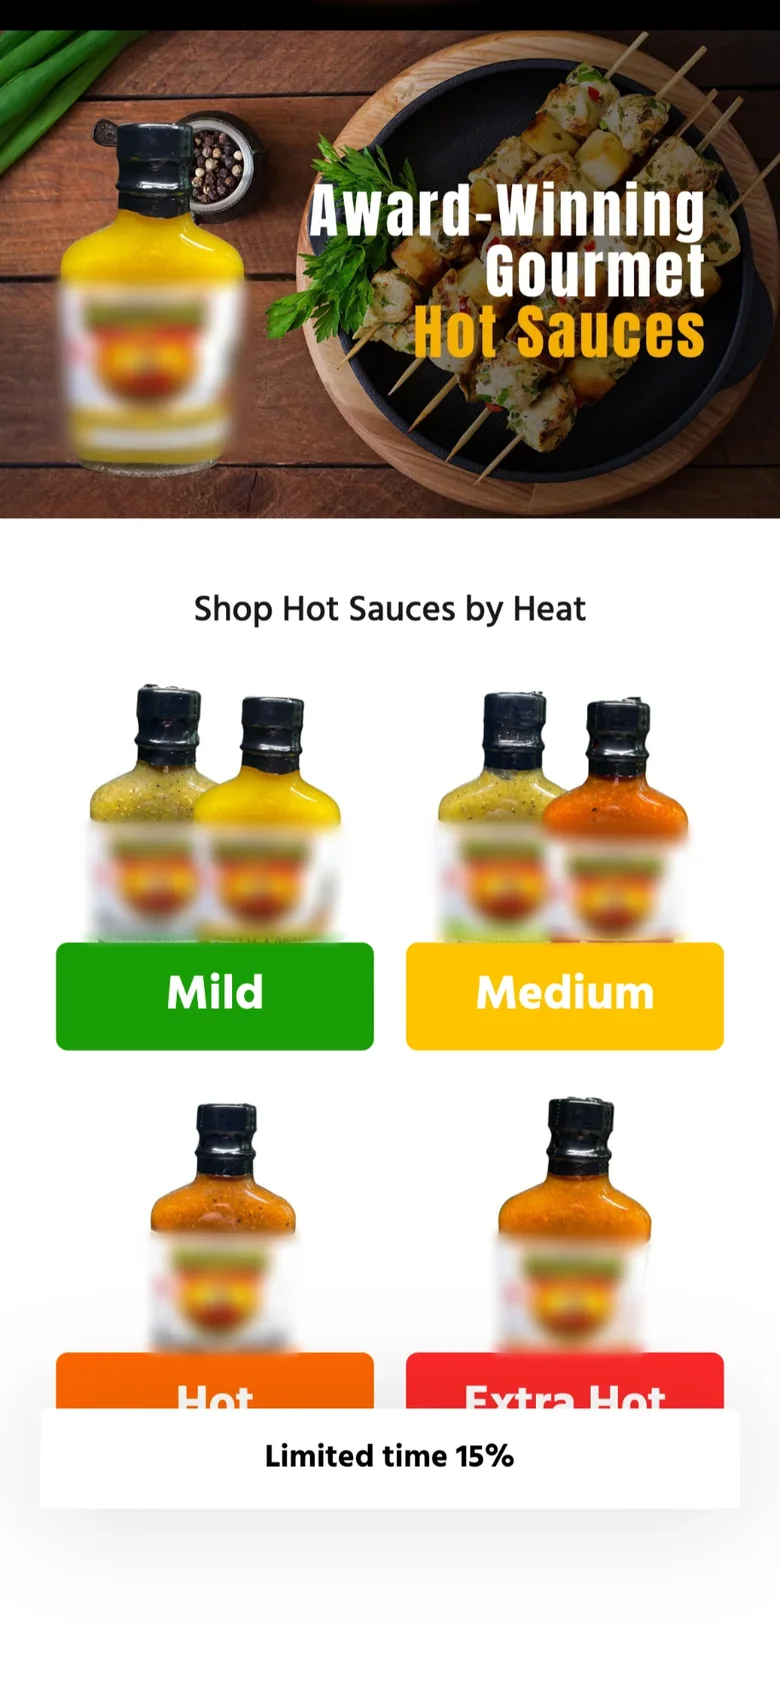
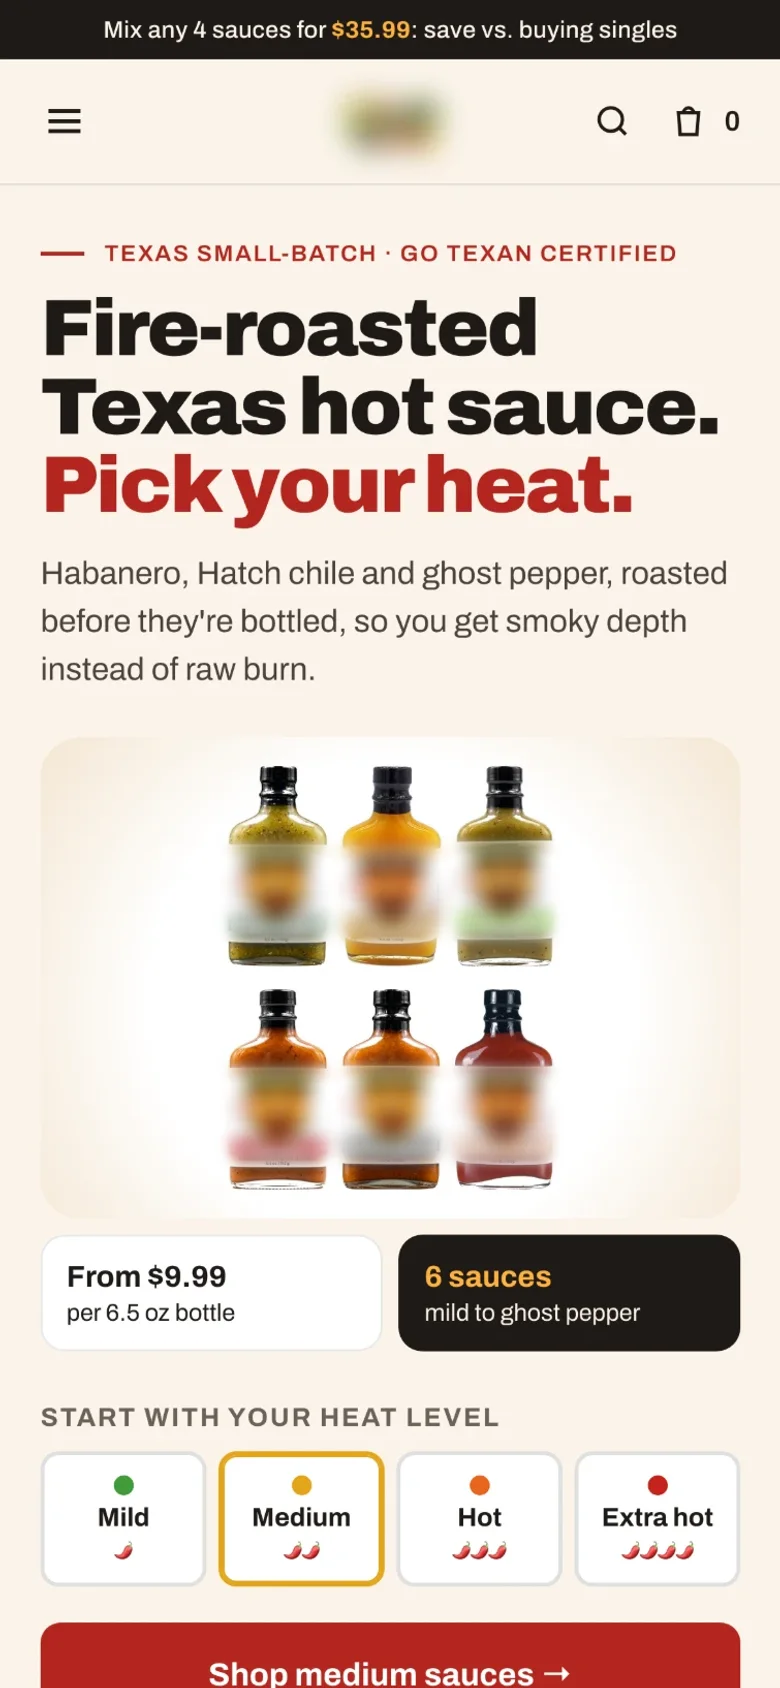
The result: a 20-day A/B test against the old homepage. The new homepage won on revenue per visitor, +8%, and bounce rate fell by 10%.
What the two winners have in common
| Candle store | Hot sauce brand | |
|---|---|---|
| Buyer’s first question | Will I smell it? | How hot is it? |
| Answer on the first screen | Scent strength scale, Light to Wow | Heat picker, Mild to Extra hot |
| Products and prices | 4 bestsellers with price in the first scroll | All 6 sauces, from $9.99 |
| Bigger orders | 3 candles for $5 shipping, 6 for free | Any 4 sauces for $35.99 |
| Proof | One line from a real review | 4.97 rating, festival wins, national retail |
| Result | +10% RPV, 12% lower bounce | +8% RPV, 10% lower bounce |
How to increase revenue per visitor on your own homepage
- Find your shopper’s first question. Read reviews and support emails. The worry that comes up most often belongs on the first screen.
- Show products and prices before the first scroll. A hero photo with no product and no price makes people work to start shopping.
- Give one main button and one helper. One path for people ready to buy, one for people who need help choosing.
- Add a reason to buy more than one. A bundle price or a shipping threshold works best on low-priced products.
- Swap claims for proof. A rating, a number or one sentence from a real customer, placed next to the button.
- Fix what looks broken. Stray characters, repeated rules and mismatched styles make first-time buyers hesitate before they enter a card.
- Test it on revenue per visitor, with bounce rate and returns as guardrails. The sample size calculator tells you how long the test needs.
If the problem starts after the homepage, see why people add to cart but don’t buy and getting traffic but no sales.
Want this for your store?
I redesign ecommerce homepages and product pages around what your shoppers need to see first, and A/B test the new version on revenue per visitor, so you see what it earned. See my ecommerce CRO work →
FAQ
How do you increase revenue per visitor on an ecommerce homepage?
Raise conversion rate and order value at the same time: answer the shopper’s first question on the first screen, show products with prices right away, add specific proof next to the button, and offer a bundle or shipping threshold. In my two tests this raised revenue per visitor by 10% and 8%.
Should an ecommerce homepage have a slider?
In the hot sauce test, replacing a five-slide photo slider with the full range, a heat picker and prices won with +8% revenue per visitor. Sliders hide most of their content and often have no clear button.
How long should an ecommerce homepage A/B test run?
At least two full weeks, so every weekday is covered. My two tests ran 20 days and 4 weeks. Use a sample size calculator to check you have enough visitors before you start.
What is a good metric for a homepage A/B test?
Revenue per visitor, because a homepage change can move both conversion rate and average order value. Use bounce rate and return rate as guardrails.
Sources

I’m George (Djordje) Peric, a CRO designer, CXL certified in Conversion Optimization and Ecommerce Marketing. I design websites, landing pages, funnels and ads, and A/B test them.